Report Week
This weeks submittal shows the optimal driving routes to the 'Top Ten Prospects in each of the 3 sales territories. The Network Analyst tool bar was utilized to find the optimal driving routes for the sales people. I also checked the attribute tables for the top ten prospects in each territory and they were somewhat equitable.
Wednesday, November 24, 2010
Tuesday, November 16, 2010
Project 4-GIS & Transportation
Week 2-Analyze-Determine Sales Territories
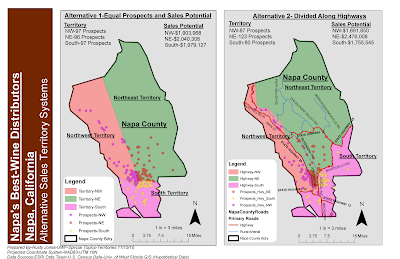
This weeks goals are to provide the fictional company, Napa's Best-Wine Distributors with a sales territory division. One system is to show a somewhat equitable system and the other is to show the territories to being divided by the major roads.
Map 1-Showing two systems for dividing the territories. One system shows an equitable system with a more or less equal number of prospects and sales potential within 5% of the mean of potential sales. The other system divides the territories by the major road system in Napa County.
Map 2- Shows the preferred system of dividing the territory by an equal number of prospects and sales potential, as shown above but with more detail.
I have chosen Alternative 1 as the most equitable system. However, I believe it is possible to design 'highway system' with equality. This would necessitate using local collector streets for the routes. This may result in longer travel times for the sales force. Alternative 1, I believe is more fair. It divides the highest density area (Napa City) amongst the sales people. I also believe that the County is not so large to create a burden, although the salesperson in the South territory will have less driving to make the sales calls. With that said, I believe most salespeople would prefer a system of equality in prospects and sales potential. Given enough time and understanding the true driving times, the highway system may have merit, but it may be difficult to design?
Tuesday, November 9, 2010
Project 4-GIS & Transportation
Week 1-Prepare--Managing Sales Territories and Routes
This project is to show a hypothetical wine distributor known as Napa's Best and how sales territories may be divided equitably to three sales people within Napa County. The maps shown below are the initial preparation showing the number of households, total number of restaurants, liquor stores and the overall wine sales within the County per household. As one can see there is a higher concentration of restaurants and liquor stores around the Napa, CA area but the restaurant, liquor and wine sales per household in the west-central portion of the county are high over a large geographical area. In the next phase of analysis it may become clearer on what the most equitable way to divide the territory is? However at this time, it appears that some equality will have to be given to divide the Napa City area amongst the sales people as the largest number of potential accounts (restaurants and liquor stores) are within this area. Guess we'll see!
This project is to show a hypothetical wine distributor known as Napa's Best and how sales territories may be divided equitably to three sales people within Napa County. The maps shown below are the initial preparation showing the number of households, total number of restaurants, liquor stores and the overall wine sales within the County per household. As one can see there is a higher concentration of restaurants and liquor stores around the Napa, CA area but the restaurant, liquor and wine sales per household in the west-central portion of the county are high over a large geographical area. In the next phase of analysis it may become clearer on what the most equitable way to divide the territory is? However at this time, it appears that some equality will have to be given to divide the Napa City area amongst the sales people as the largest number of potential accounts (restaurants and liquor stores) are within this area. Guess we'll see!
Subscribe to:
Comments (Atom)


